Search
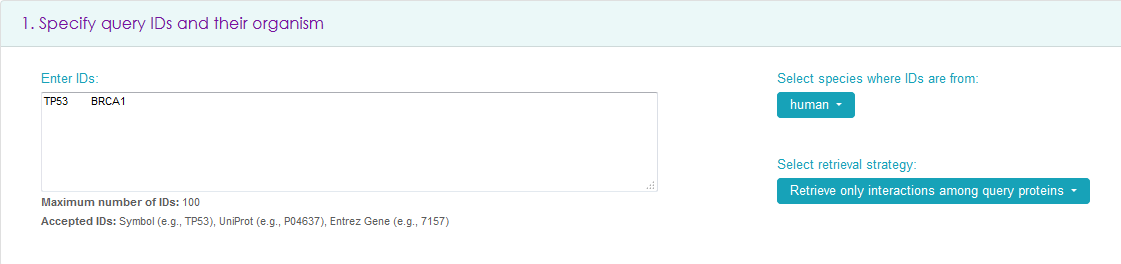
Specify Query IDs and their organism - the only mandatory part
In the search box, insert a maximum of 1000 IDs (Gene Symbols, UniProt IDs, or Entrez Gene IDs) in tab, newline or comma separated format. The search is case sensitive.
On the right, select the species the IDs are from - only one species is allowed (human is the default). It is also possible to select between retrieving all interactions of query proteins (e.g., querying for TP53 and BRCA1 will give all interactions of TP53 and of BRCA1) or all interactions among query proteins (e.g. querying for TP53 and BRCA1 will give only the interaction between TP53 and BRCA1 and the interactions of the proteins with themselves, if present).
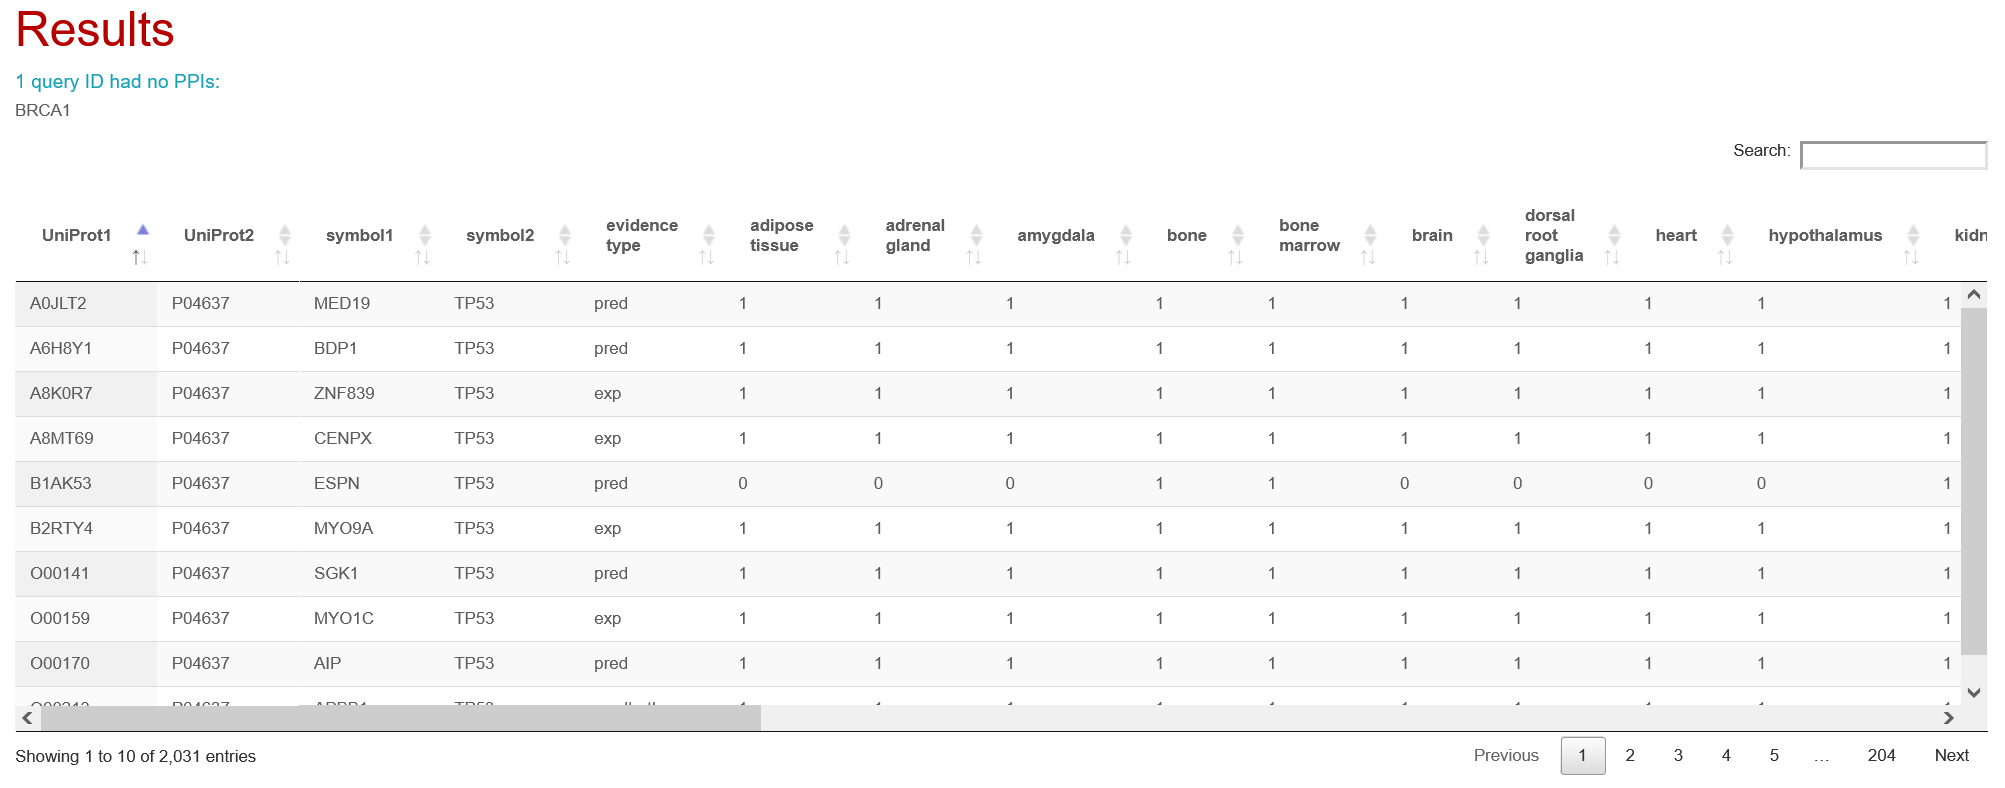
Then scroll down to the bottom of the page and click 'View Results' to see results in a tabular format and visualized as a network graph, or click 'Download' to obtain a file with the results.
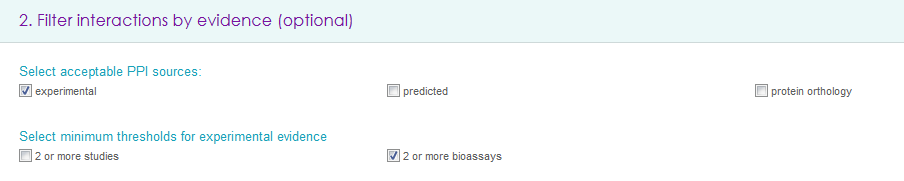
Filter interactions by evidence (optional)
It is possible to select any (multiple choices accepted) of the acceptable PPI sources (i.e. experimental, predicted or orthology based interactions) and minimum threshold for experimental evidence: to improve the confidence of retrieved PPIs it is possible to filter out interactions that have been reported by only one study and/or that have been discovered by only one method (e.g. using only mass spectrometry or only yeast two hybrid).

Filter interactions by context and other properties (optional)
PPIs can be filtered by any number of contexts (e.g., developmental stages, tissues) or other features (e.g., conservation across species, druggability). For example, a simple filter could be set by opening the Tissues panel and selecting kidney and liver. Running a query with this filter (clicking 'View Results' or 'Download') would keep only PPIs that have both genes expressed in kidney or both expressed in liver. There are several options for adjusting how the filter is applied. These options are shown at the bottom of the Tissues panel, under the heading 'Refine how filtering is applied'. One pair of options determines whether retrieved PPIs can be in any selected tissues (default) or should be in all of them. A second pair of options adjusts how PPIs are assigned to tissues: 'Both proteins (genes) are expressed in the tissue' (default) or 'One or both proteins (genes) are expressed in the tissue'. Other context types (e.g., Sub-cellular localizations) have similar options for adjusting how filtering is applied.

A filter can include multiple types of contexts and PPI features: for example, a filter could specify that PPIs should be in '(kidney or liver) and (cytoplasm or nucleus) and conserved in (mouse or rat)'. IID combines different types of contexts/features with 'and' statements, but within each context/feature, all filtering adjustments are still available. For example, the above filter could be adjusted to '(kidney and liver) and (cytoplasm or nucleus) and (mouse or rat)', by selecting 'Retrieved PPIs should occur in all selected tissues' in the Tissues panel.

Filters can include both detailed and high level tissues. Brain detailed tissues as well as diseases are built as ontologies so it is possible to select either the parent term (and automatically all terms below) or one/some child terms. For example, a researcher might be interested in retrieving for the proteins of interest normal lung tissue interactions as well as lung cancer interactions, to compare networks from healthy and diseased state of lungs. The researcher would then have to input proteins in the search box, select lung under tissue filter and then lung cancer in the disease ontology. This will allow retrieval of interactions that present one or the other annotation.

Each attribute selected for filtering will be visible in the results table and will be available for enrichment analysis.
Specify PPI annotations to retrieve (optional)
It is possible to retrieve all annotations for interactions of interest by specifying them in this field. PPIs will be annotated with all attributes from the selected categories (e.g., selecting 'sub-cellular localizations' will include all 13 available localizations as columns in the results table). All selected context types and PPI features will be available for enrichment analysis.


Analysis
Analysis options become available when query results are returned. They appear below the results table and network visualization.
Analyze PPI annotations
PPI context and feature annotations can be analyzed for enrichment in the retrieved network. Most types of annotations, including all contexts (e.g., tissues), druggability, and membership in complexes can be analyzed in four ways:
-
enrichment can be calculated among PPIs, with the assumption that a PPI has an annotation (e.g., kidney) if both proteins (genes) are annotated (e.g., expressed in kidney)
-
enrichment can be calculated among PPIs, with the assumption that a PPI has an annotation if one or both proteins are annotated
-
enrichment can be calculated among all network proteins
-
enrichment can be calculated only among partners of query proteins
Analysis results are returned as barplots showing the number and percentage of network PPIs or proteins with each annotation. Color indicates the significance of enrichment.
Analyze topology
To obtain topology measures, a researcher must have input one or more proteins in the search tab and clicked 'View Results'. In the analyze topology panel, it is possible to retrieve degree, and clustering coefficient for each query protein and the retrieved interactors. These topology measures are calculated for each searched set of proteins and are not the global values for the same proteins if all IID would be considered.
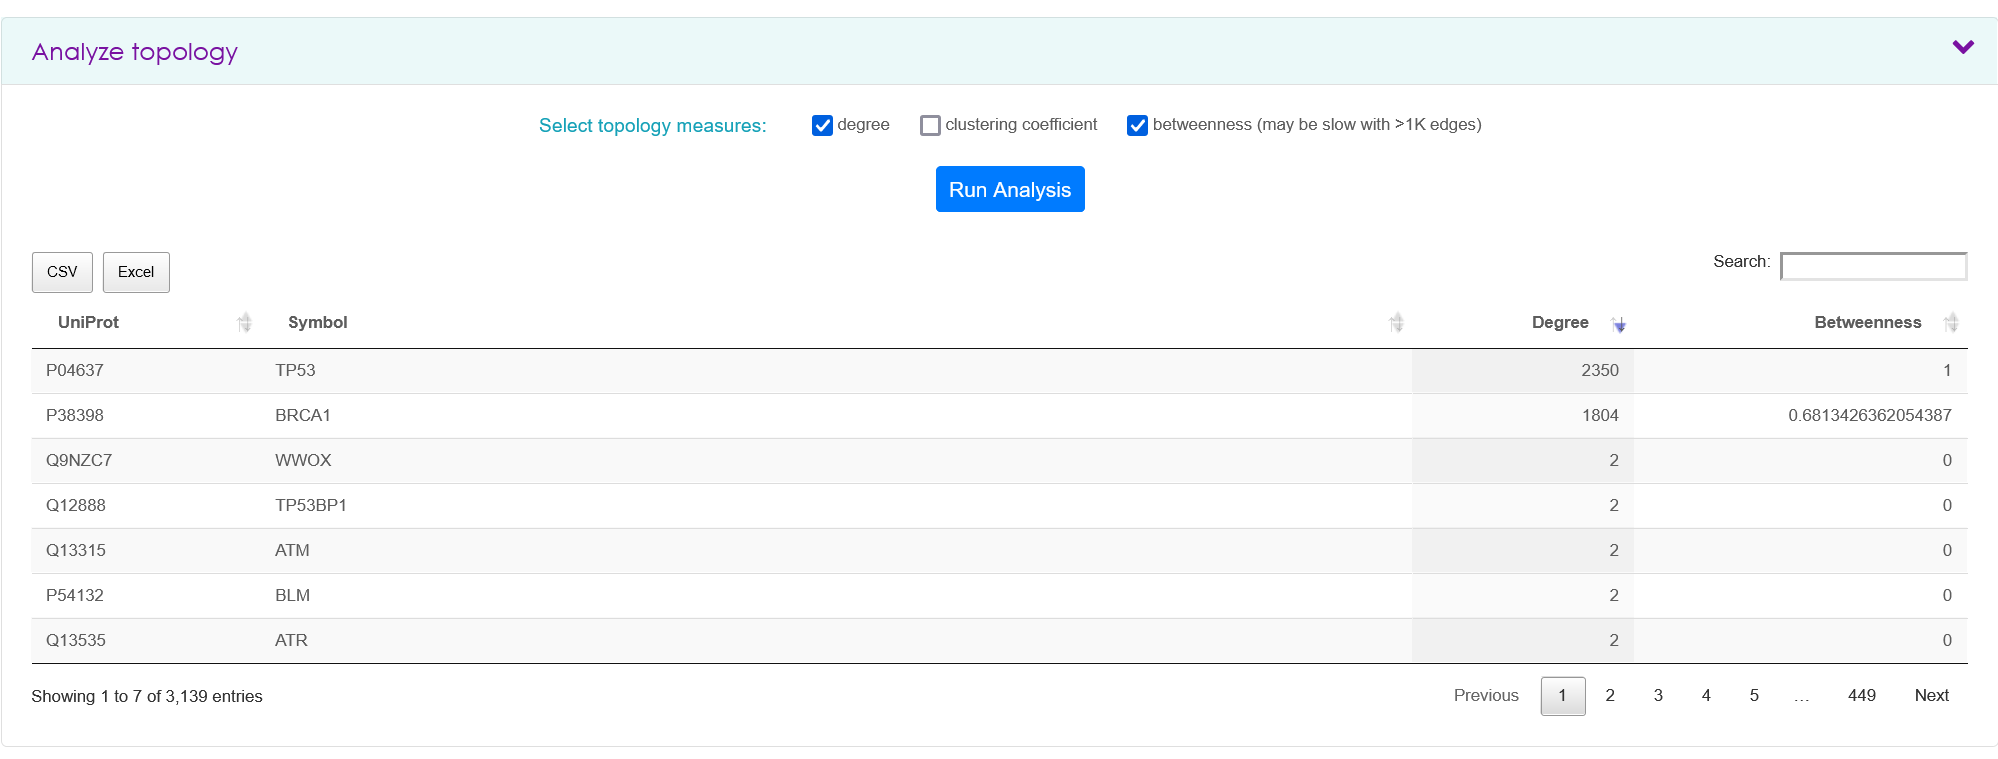
All tables obtained in the analysis tab are downloadable as CSV or Excel format.